
INTRODUCTION
The specialized vocabulary of a profession serves as a defining characteristic, showcasing its expertise and enabling effective communication within its domain.
This blog post provides definitions of various terms gathered from online sources. While we have aimed to align with industry standards and formal usage, it’s important to recognize that some terms may carry alternative meanings or interpretations depending on specific industries or organizations.
These definitions are offered to support clarity in communication, rather than to serve as a universal standard.
Performance testing
Software performance testing is a testing approach that assesses a system’s performance and validates its quality attributes, such as responsiveness, speed, scalability, and stability, under various load conditions.
The system is tested under a range of load conditions to determine the system’s response time under different workloads. The purpose of software performance testing is not only to detect bugs in the system but also to identify and eliminate performance bottlenecks in the system. This involves testing an application to ensure it functions as expected under various load conditions.
Load testing
Load testing involves assessing the ability of software to handle varying levels of traffic while ensuring a prompt response. This test determines the system’s capacity to manage normal and anticipated peak load conditions.
Load testing is critical in identifying bottlenecks within systems, enabling their resolution to provide an uninterrupted user experience when traffic is high after the system goes live. Load testing tools typically record tests while users perform actions and generate a script using a script recorder. The generated script is then replayed to test the system by increasing the number of users accessing the system simultaneously and changing the parameters.
Stress testing
Stress testing is a type of performance testing carried out to assess a system’s or component’s capabilities under conditions that go beyond its anticipated or specified workloads or with limited access to resources such as memory or servers. Stress testing aims to identify how the system performs in these extreme conditions and determine its breaking point.
Stress testing is a form of performance testing that aims to assess an application’s behaviour when subjected to load conditions beyond normal or peak levels. Its primary goal is to expose application bugs that may only emerge under high load conditions, such as synchronization issues, race conditions, and memory leaks. Stress testing is an effective means of identifying the weak points of an application and analyzing its behaviour under extreme load conditions.
Exploratory stress testing
Exploratory stress testing involves subjecting a system, application, or component to a set of unusual parameters or conditions that are unlikely to occur in the real world but are still possible.
This testing approach can be seen as an interactive process of learning, test design, and test execution. Typically, exploratory stress tests are created by modifying existing tests or working with application/system administrators to create improbable but plausible scenarios within the system.
This stress testing is often not carried out in isolation, as it is usually performed to determine whether more systematic stress testing is necessary for a specific failure mode.
Application stress testing
Multi-transactional stress testing typically concentrates on multiple systemic transactions under stress without component isolation. When conducting application stress testing, defects related to data locking and blocking, network congestion, and performance bottlenecks on various components or methods throughout the entire application will likely be discovered.
Since the test scope is a single application, this type of stress testing is often used after a comprehensive application load-testing effort or as the final test phase for capacity planning. Additionally, defects related to race conditions and memory leaks stemming from shared code or components are frequently uncovered during this type of testing.
Transactional stress testing
Transactional stress tests involve operating at a transactional level with load volumes that exceed the expected production operations. The primary goal of these tests is to validate behaviour under stressful conditions, such as high load with limited resources, when testing the entire application. By isolating an individual transaction or group of transactions, these tests provide a precise understanding of the throughput capacities and other characteristics for specific components without the added complexity of inter-component interactions that arise during application-level testing. These tests help tune, optimize, and identify error conditions at the specific component level.
Systemic stress testing
In this type of test, stress or extreme load conditions are generated across multiple applications running on the same system, pushing the boundaries of the applications’ expected capabilities to an extreme. Systemic stress testing aims to uncover defects in situations where different applications block one another and compete for system resources such as memory, processor cycles, disk space, and network bandwidth. This type of testing is also known as integration stress testing or consolidation stress testing.
In large-scale systemic stress tests, you combine all applications in the same consolidated environment. Some organizations choose to perform this type of testing in a larger test lab facility, sometimes with the hardware or software vendor’s assistance.
Volume testing
Volume testing is non-functional performance testing in which a software system is subjected to a large volume of data, often called flood testing. The purpose of volume testing is to analyze the system’s performance by increasing the amount of data in the database. The impact on response time and system behaviour can be studied by conducting volume testing when the system is exposed to a high volume of data.
This testing type helps identify performance bottlenecks and scalability issues that may arise when the system is dealing with large amounts of data.
Performance tuning
As performance bottlenecks are identified during load testing and performance testing, these issues are commonly rectified through a process of performance tuning. Performance tuning can involve configuration changes to hardware, software and network components.
A common bottleneck is the configuration of the application and database servers. Performance tuning can also include tuning SQL queries and tuning applications underlying code to cater for concurrency and to improve efficiency. Performance tuning can result in hardware changes being made. This is the last resort; ideally, tuning changes will reduce resource utilization.
Session management
Session management is the process of securing multiple requests for a service from the same user or entity. A session is often initialized by authenticating a user or entity with factors such as a password. Once the user is authenticated, subsequent requests authenticate the session instead of the user.
Session ID
A session ID is a unique number that a Web site’s server assigns a specific user for the duration of that user’s visit (session). The session ID can be stored as a cookie, form field, or URL (Uniform Resource Locator).
Every time an Internet user visits a specific Web site, a new session ID is assigned. Closing a browser, reopening, and visiting the site again generate a new session ID. However, the same session ID is sometimes maintained if the browser is open, even if the user leaves the site in question and returns. Sometimes, Web servers terminate a session and assign a new session ID after a few minutes of inactivity (timeout).
Concurrent users
Concurrent users are essentially multiple users accessing the system simultaneously, each with unique requests or actions.
Unlike simultaneous users, they may not necessarily be sending the same request at the same time. The main idea is that they are all active and interacting with the system at the same time.
Simultaneous users
Simultaneous users refer to multiple users who are accessing the system and sending requests at the same time.
This is often done during performance testing to simulate realistic usage scenarios and evaluate the system’s ability to handle concurrent user activity. By testing with simultaneous users, the system’s response time, throughput, and resource usage can be measured and analyzed to identify any performance issues or bottlenecks.
Endurance (Soak) testing
Endurance testing is a form of performance testing that assesses the stability and performance of a system over an extended period of time, usually by maintaining a specific level of user concurrency. By subjecting a system to prolonged stress, endurance testing can reveal issues related to memory allocation, log file handles, and database resource utilization that may not be apparent during shorter load tests.
It is important to note that endurance testing is a type of load testing and focuses on the product’s performance when subjected to a workload for a prolonged period. In JMeter, the duration of the test can be set in the schedule section of the thread group.
Spike testing
Spike testing is a type of load test. The object of this type of performance test is to verify a system’s stability during bursts of the concurrent user and or system activity to varying degrees of load over varying time periods.
A spike test is a type of performance test focused on determining or validating performance characteristics of the product under test when subjected to workload models and load volumes that repeatedly increase beyond anticipated production operations for short periods of time. Spike testing is a subset of stress testing.
Spike testing is a subset of stress testing. A spike test is a type of performance test focused on determining or validating the performance characteristics of the product under test when subjected to workload models and load volumes that repeatedly increase beyond anticipated production operations for short periods of time.
Synchronizing timer can be used for simulating the spikes in JMeter. The purpose of the SyncTimer is to block threads until X number of threads have been blocked, and then they are all released at once. A SyncTimer can thus create large instant loads at various points of the test plan.
Baseline testing
Creating a baseline is the process of running a set of tests to capture performance metric data to evaluate the effectiveness of subsequent performance-improving changes to the system or application.
A critical aspect of a baseline is that all characteristics and configuration options except those specifically being varied for comparison must remain invariant. Once a part of the system that is not intentionally being varied for comparison to the baseline is changed, the baseline measurement is no longer a valid basis for comparison.
Benchmark testing
Benchmarking is comparing your system’s performance against a baseline you have created internally or against an industry standard endorsed by some other organization.
By benchmarking your system, you can gain insight into how your system performs under various workloads and identify areas for optimization and improvement.
Capacity
The capacity of a system is the total workload it can handle without violating predetermined key performance acceptance criteria.
Capacity testing
A capacity test complements load testing by determining your server’s ultimate failure point, whereas load testing monitors result at various levels of load and traffic patterns. You perform capacity testing in conjunction with capacity planning, which you use to plan for future growth, such as an increased user base or increased volume of data. For example, to accommodate future loads, you need to know how many additional resources (such as processor capacity, memory usage, disk capacity, or network bandwidth) are necessary to support future usage levels. Capacity testing helps you to identify a scaling strategy to determine whether you should scale up or scale out.
Investigation
The investigation is an activity based on collecting information related to the speed, scalability, and/or stability characteristics of the product under test that may have value in determining or improving product quality.
The investigation is frequently employed to prove or disprove hypotheses regarding the root cause of one or more observed performance issues.
Component testing
A component test is any performance test that targets an architectural component of the application. Commonly tested components include servers, databases, networks, firewalls, clients, and storage devices.
Smoke testing
A smoke test is the initial run of a performance test to see if your application can perform its operations under a normal load.
Unit test
In the context of performance testing, a unit test is any test that targets a module of code where that module is any logical subset of the entire existing code base of the application, focusing on performance characteristics. Commonly tested modules include functions, procedures, routines, objects, methods, and classes. Performance unit tests are frequently created and conducted by the developer who wrote the module of code being tested.
Validation test
A validation test compares the product’s speed, scalability, and/or stability characteristics under test against the expectations that have been set or presumed for that product.
Ramp up period
The ramp-up period defines how long JMeter should take to start all the threads. If there are ten threads and a ramp-up time of 100 seconds, then each thread will begin 10 seconds after the previous thread started, for a total time of 100 seconds to get the test fully up to speed
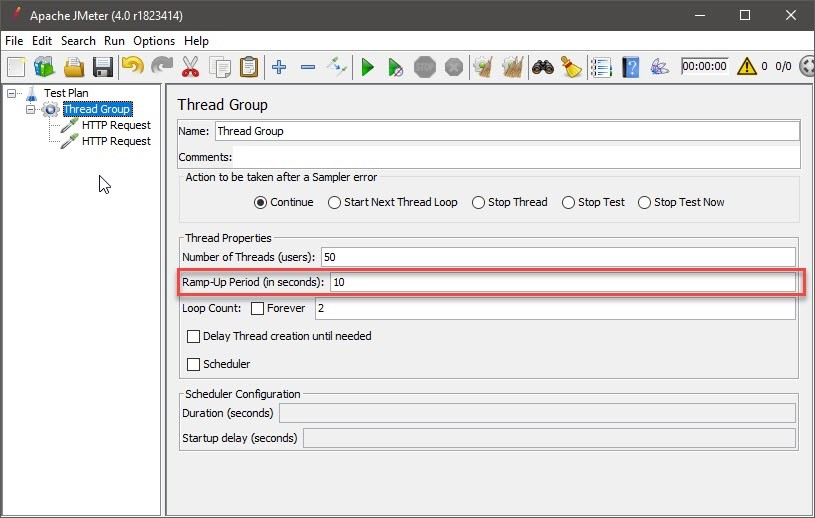
Ramp Up period can be defined in the Thread Groups.
Ramp-down period (Shutdown time)
Ramp-down is the amount of time taken to stop the threads.
Ramp down cannot be defined in normal thread groups coming with JMeter. Defining the ramp down in thread groups installed from JMeter plugins is possible. E.g. Ultimate Thread Group.
Throughput
In JMeter, throughput is calculated as requests/units of time. The time is calculated from the first sample’s start to the last sample’s end. This includes any intervals between samples, as it is supposed to represent the load on the server.
The formula is Throughput = (number of requests) / (total time).
Throughput is measured in requests per second/minute/hour. The time unit is chosen so that the displayed rate is at least 1.0. When the throughput is saved to a CSV file, it is expressed in requests/second, i.e. 30.0 requests/minute is saved as 0.5.
Elapsed time
Elapsed time (= Sample time = Load time = Response time) is the difference between the time when a request was sent and the time when the response has been fully received.
JMeter measures the elapsed time from just before sending the request to just after receiving the last response. JMeter does not include the time needed to render the response, nor does JMeter process any client code, for example, Javascript.
Elapsed time should be greater or equal to the latency.
Latency
Latency is the difference between when a request was sent and when a response started to be received.
Workload
The workload is the stimulus applied to a system, application, or component to simulate a usage pattern regarding concurrency and/or data inputs. The workload includes the total number of users, concurrent active users, data and transaction volumes, and the transaction mix. For performance modelling, you associate a workload with an individual scenario.
Distributed (Remote) testing
Distributed Testing is a kind of testing which use multiple systems to perform Stress Testing. Distributed testing is applied for testing websites and server applications when they are working with multiple clients simultaneously.
Distributed testing is used when the single JMeter engine cannot create the required number of virtual users (threads) for the test.
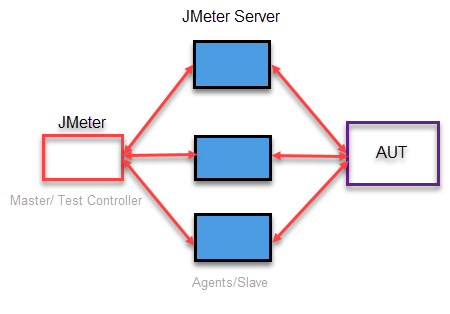
Agent (Salve)
The test agents are used to run the tests and collect data including system information and response time information behalf of the test controllers.
Jmeter server (jmeter-server.bat) work as load generating agents.
The test agent runs as a service that listens for requests from the test controller to start a new test. When the test agent receives a request, the test agent service starts a process on which to run the tests. Each test agent runs the same test plan.
Master
The Master or test controller is used to administering the test agents and collect test results.
The test controller provides a general architecture for running tests and includes special features for running load tests. The test controller sends the load test to all test agents and waits until all the test agents have initialized the test. When all test agents are ready, the test controller sends a message to the test agents to start the test.
Stop test
Stop a test gracefully completing the samplers being processed.
Shutdown test
Stop a test abruptly (immediately) without processing the samplers being processed.
MIME type
MIME stands for “Multipurpose Internet Mail Extensions. It’s a way of identifying files on the Internet according to their nature and format.
Think time (user delay)
The more accurately users are modeled, the more reliable performance test results will be. One frequently overlooked aspect of accurate user modeling is the modeling of user delays. This section explains how to determine user delay times to be incorporated into your workload model and subsequently into your performance scripts.
During a session, the user can be in a number of different states — browsing, logging onto the system, and so on. Customers will have different modes of interacting with the Website; some users are familiar with the site and quickly go from one page to another, while others take longer to decide which action they will take. Therefore, characterizing user behavior must involve modeling the customer sessions based on page flow, the frequency of hits, the amount of time users’ pause between viewing pages, and any other factor specific to how users interact with your Website.
Delays that occur while users view content on Web pages — also commonly known as think times — represent the answers to questions such as “How long does it take a user to enter their login credentials?” and “How much time will users spend reading this page?” You can use several different methods to estimate think times associated with user activities on your Web site. The best method, of course, is to use real data collected about your production site. This is rarely possible, however, because testing generally occurs before the site is released to production. This necessitates making educated guesses or approximations regarding activity on the site.
Samplers
Samplers perform the actual work of JMeter. Samplers send requests to the target. Each sampler (except Test Action) generates one or more sample results. The sample results have various attributes (success/fail, elapsed time, data size etc.) and can be viewed in the various listeners.
Logic controllers
Logic Controllers determine the order in which Samplers are processed. They can be used for conditional execution of the samplers in the context. Samplers are executed sequentially when logic controllers are not used.
Listeners
Listeners collect the test results and make them available for the users to view, save or read the same test results.
Configuration elements
Configuration elements can be used to set up defaults and variables for later use by samplers. Note that these elements are processed at the start of the scope in which they are found, i.e. before any samplers in the same scope.
Assertions
Assertions are used to perform additional checks on samplers and are processed after every sampler in the same scope. To ensure that an Assertion is applied only to a particular sampler, add it as a child of the sampler.
Timers
Timers are used for pausing the samplers before sending the requests. Timers work in conjunction with the samplers. A timer which is not in the same scope as a sampler will not be processed at all.
Timers are used for simulating the user delays (thinking time of the users) in JMeter.
Pre-processors
Preprocessors are used to modify the Samplers in their scope. Preprocessors are applied before the samplers in the scope.
Post-processors
Post-Processors are applied after samplers. They are applied to all the samplers in the same scope, so to ensure that a post-processor is applied only to a particular sampler, add it as a child of the sampler.
Postprocessors are used for extracting the session IDs from the responses and use them in subsequent samplers (requests) in web applications testing.
Proxy
Proxy server is a server that acts as an intermediary for requests from clients (Web browser ) seeking resources from other servers (web server)
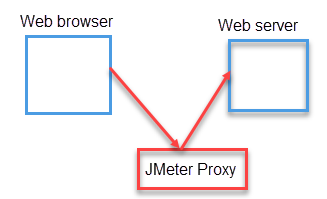
The HTTP(s) Test Recorded recorder in JMeter is implemented as an HTTP(S) proxy server. You need to set up your browser use the proxy for all HTTP and HTTPS requests.
JMeter variables
JMeter variables are available to individual threads. They are not shared with the threads.
JMeter properties
JMeter properties are shared through threads. JMeter properties defined in property files can be accessed through any test plan. System properties can be overwritten by the JMeter properties.
The properties present in jmeter.properties or reportgenerator.properties should be set in the user.properties file. These properties are only taken into account after restarting JMeter as they are usually resolved when the class is loaded.
The Property Display shows the values of System or JMeter properties. Values can be changed by entering new text in the Value column.
Properties are common to all threads and need to be referenced using the __P or __property function.
JMeter processes function and variable references before passing the script field to the interpreter, so the references will only be resolved once. Variable and function references in script files will be passed verbatim to the interpreter, which is likely to cause a syntax error.
- props.get(“START.HMS”);
- props.put(“PROP1″,”1234”);
System properties
System properties are commonly used by any Java application. Apache JMeter is a pure Java application hence it inherits all default properties and has the capabilities to access and override them.
User properties
A custom user defines properties can be defined in user.properties file. The values, specified in user.properties file override corresponding values from jmeter.properties file.
Metrics
Metrics are measurements obtained by running performance tests as expressed on a commonly understood scale. Some metrics commonly obtained through performance tests include processor utilization over time and memory usage by the load.
Network-specific metrics
This set of metrics provides information about the overall health and efficiency of your network, including routers, switches, and gateways.
System-related metrics. This set of metrics helps you identify the resource utilization on your server. The resources being utilized are the processor, memory, disk I/O, and network I/O.
Platform-specific metrics
Platform-specific metrics are related to software that is used to host your application, such as the Microsoft .NET Framework common language runtime (CLR) and ASP.NET-related metrics.
Application-specific metrics
These include custom performance counters inserted in your application code to monitor application health and identify performance issues. You might use custom counters to determine the number of concurrent threads waiting to acquire a particular lock or the number of requests queued to make an outbound call to a Web service.
Service-level metrics
These metrics can help to measure overall application throughput and latency, or they might be tied to specific business scenarios.
Business metrics
These metrics are indicators of business-related information, such as the number of orders placed in a given timeframe.
Performance acceptance criteria
Identify the response time, throughput, and resource utilization goals and constraints. In general, response time is a user concern, throughput is a business concern, and resource utilization is a system concern. Additionally, identify project success criteria that may not be captured by those goals and constraints; for example, using performance tests to evaluate what combination of configuration settings will result in the most desirable performance characteristics.
Implement test design
Develop the performance tests in accordance with the test design
Execute the tests
Run and monitor your tests. Validate the tests, test data, and results collection. Execute validated tests for analysis while monitoring the test and the test environment.
Scenarios
In the context of performance testing, a scenario is a sequence of steps in your application. A scenario can represent a use case or a business function such as searching a product catalog, adding an item to a shopping cart, or placing an order.
Testing environment
The test environment includes the physical test environment and the production environment as well as the tools and resources available to the test team. The physical environment includes hardware, software, and network configurations. Having a thorough understanding of the entire test environment at the outset enables more efficient test design and planning and helps you identify testing challenges early in the project. In some situations, this process must be revisited periodically throughout the project’s lifecycle.
Configure test environment
Prepare the test environment, tools, and resources necessary to execute each strategy as features and components become available for test. Ensure that the test environment is instrumented for resource monitoring as necessary.
Staging environment
Staging is an environment for final testing immediately prior to deploying to production. It seeks to mirror the actual production environment as closely as possible and may connect to other production services and data, such as databases.
Production environment
The production environment is also known as live, particularly for servers, as it is the environment in that users directly interact.
Performance tests should not be executed against the production environment unless there is a specific reason.
Dynamic data
Dynamic data is data that is changed when information is updated. For example, session variables connected to authentication mechanisms. This affects website recording, as JMeter needs to know how to capture this dynamic data and reuse it in subsequent requests. Otherwise, playing back the recording will show many errors.
This is where Correlations come in. Correlations are fetching dynamic data from preceding requests and posting it to subsequent requests.
In JMeter, various post-processors can be used for extracting the dynamic data from responses and used in subsequent requests.
Memory leaks
Failure to release reachable memory, which is no longer needed for your program to function correctly.
Minimum time
In JMeter: The lowest elapsed time for the samples with the same label
Maximum time
In JMeter: The longest elapsed time for the samples with the same label
Average
A mean or average response time is the sum of individual response time divided by the number of responses.
Percentile
Percentile is the value below which a percentage of data falls.
A percentile is a straightforward concept that is easier to demonstrate than define. For example, to find the 95th percentile value for a data set consisting of 100 page-response-time measurements, you would sort the measurements from largest to smallest and then count down six data points from the largest. The 6th data point value represents the 95th percentile of those measurements. For the purposes of response times, this statistic is read “95 percent of the simulated users experienced a response time of [the 6th-slowest value] or less for this test
Scenario –
- 90% Line – 90% of the samples took no more than this time. The remaining samples took at least as long as this. (90th percentile)
- 95% Line – 95% of the samples took no more than this time. The remaining samples took at least as long as this. (95th percentile)
- 99% Line – 99% of the samples took no more than this time. The remaining samples took at least as long as this. (99th percentile)
Medians
A median is simply the middle value in a data set when sequenced from lowest to highest. In cases where there is an even number of data points and the two center values are not the same, some disciplines suggest that the median is the average of the two center data points, while others suggest choosing the value closer to the average of the entire set of data.
Standard deviation
By definition, one standard deviation is the amount of variance within a set of measurements that encompasses approximately the top 68 percent of all measurements in the data set; in other words, knowing the standard deviation of your data set tells you how densely the data points are clustered around the mean. Simply put, the smaller the standard deviation, the more consistent the data.
A common rule, in this case: “Data with a standard deviation greater than half of its mean should be treated as suspect. If the data is accurate, the phenomenon the data represents is not displaying a normal distribution pattern.”
Normal value
A normal value is a single value that occurs most often in a data set.
Normal distribution
Also known as bell curves, normal distributions are data sets whose member data are weighted toward the center (or median value). When graphed, the shape of the “bell” of normally distributed data can vary from tall and narrow to short and squat, depending on the standard deviation of the dataset. The smaller the standard deviation, the taller and more narrow the “bell.” Statistically speaking, most measurements of human variance result in data sets that are normally distributed. As it turns out, end-user response times for Web applications are also frequently normally distributed.
Uniform distribution
Uniform distributions ― sometimes known as linear distributions ― represent a collection of data that is roughly equivalent to a set of random numbers evenly spaced between the upper and lower bounds. In a uniform distribution, every number in the data set is represented approximately the same number of times. Uniform distributions are frequently used when modeling user delays but are not common in response time results data. In fact, uniformly distributed results in response time data may be an indication of suspect results.
Outliers
Outliers are atypical, infrequent observations: data points which do not appear to follow the distribution of the rest of the sample. These may represent consistent but rare traits, or be the result of measurement errors or other anomalies which should not be modeled.
From a purely statistical point of view, any measurement that falls outside of three standard deviations, or 99 percent, of all collected measurements is considered an outlier. The problem with this definition is that it assumes that the collected measurements are both statistically significant and distributed normally, which is not at all automatic when evaluating performance test data.
A note of caution: identifying a data point as an outlier and excluding it from results summaries does not imply ignoring the data point. Excluded outliers should be tracked in some manner appropriate to the project context in order to determine, as more tests are conducted if a pattern of concern is identified in what by all indications are outliers for individual tests.
User Abandonment
This metric represents the length of time that users will wait for a page to load before growing dissatisfied and exiting the site. Sessions that are abandoned are quite normal on the Internet and consequently will have an impact on the load test results.
User abandonment refers to situations where customers exit the Web site before completing a task, because of performance slowness. People have different rates of tolerance for performance, depending on their psychological profile and the type of page they request. Failing to account for user abandonment will cause loads that are highly unrealistic and improbable. Load tests should simulate user abandonment as realistically as possible or they may cause types of load that will never occur in real life — and create bottlenecks that might never happen with real users. Load tests should report the number of users that might abandon the Website due to poor performance.
User abandonment can be simulated using duration assertions in JMeter along with “Action to be taken after a Sampler error” set to “Start Next Thread Loop” in Thread Groups.
Performance requirements
Performance requirements are those criteria that are absolutely non-negotiable due to contractual obligations, service level agreements (SLAs), or fixed business needs. Any performance criterion that will not unquestionably lead to a decision to delay a release until the criterion passes is not absolutely required ― and therefore, not a requirement.
Performance goals
Performance goals are the criteria that your team wants to meet before product release, although these criteria may be negotiable under certain circumstances. For example, if a response time goal of three seconds is set for a particular transaction but the actual response time is 3.3 seconds, it is likely that the stakeholders will choose to release the application and defer performance tuning of that transaction for a future release.
Performance thresholds
Performance thresholds are the maximum acceptable values for the metrics identified for your project, usually specified in terms of response time, throughput (transactions per second), and resource-utilization levels. Resource-utilization levels include the amount of processor capacity, memory, disk I/O, and network I/O that your application consumes. Performance thresholds typically equate to requirements.
Performance targets
Performance targets are the desired values for the metrics identified for your project under a particular set of conditions, usually specified in terms of response time, throughput, and resource-utilization levels. Resource-utilization levels include the amount of processor capacity, memory, disk input/output (I/O), and network I/O that your application consumes. Performance targets typically equate to project goals.
Performance objectives
Performance objectives are usually specified in terms of response times, throughput (transactions per second), and resource-utilization levels and typically focus on metrics that can be directly related to user satisfaction.
Performance testing objectives
Performance-testing objectives refer to data collected through the process of performance testing that is anticipated to have value in determining or improving the quality of the product. However, these objectives are not necessarily quantitative or directly related to a performance requirement, goal, or stated quality of service (QoS) specification
Performance Budgets
Performance budgets (sometimes known as performance allocations) are constraints placed on developers regarding allowable resource consumption for their component.
Scalability
Scalability refers to an application’s ability to handle the additional workload without adversely affecting performance by adding resources such as a processor, memory, and storage capacity.
Saturation
Saturation refers to the point at which a resource has reached full utilization.
Resource utilization
Resource utilization is the cost of the project in terms of system resources. The primary resources are a processor, memory, disk I/O, and network I/O.
Setup
Setup is the process planned to run before executing any of the test scenarios.
In JMeter. Setup Thread Groups are used for incorporating processes to execute before any of the normal thread groups start their tests.
Teardown
Teardown is the process planned to run after executing all the test scenarios.
In JMeter, Teardown Thread Groups are used for incorporating processes to execute after all the thread groups finish their tests.
References
Glossary.istqb.org. (2018). ISTQB Glossary. [online]
Available at: http://glossary.istqb.org/search/stress%20testing
[Accessed 8 May 2018].
Jmeter.apache.org. (2018). Apache JMeter – User’s Manual: Glossary. [online]
Available at: https://jmeter.apache.org/usermanual/glossary.html
[Accessed 8 May 2018].
Msdn.microsoft.com. (2018). Chapter 2 – Types of Performance Testing. [online]
Available at: https://msdn.microsoft.com/en-us/library/bb924357.aspx
[Accessed 8 May 2018].
Msdn.microsoft.com. (2018). Performance Testing Guidance for Web Applications [online]
Available at: https://msdn.microsoft.com/en-us/library/bb924375.aspx
[Accessed 9 May 2018].
Testingperformance.org. (2018). Home – Testing Performance. [online]
Available at: http://www.testingperformance.org
[Accessed 8 May 2018].
Author: Janesh Kodikara
Performance Tester | JMeter Trainer | Software Testing Service Provider
Comments